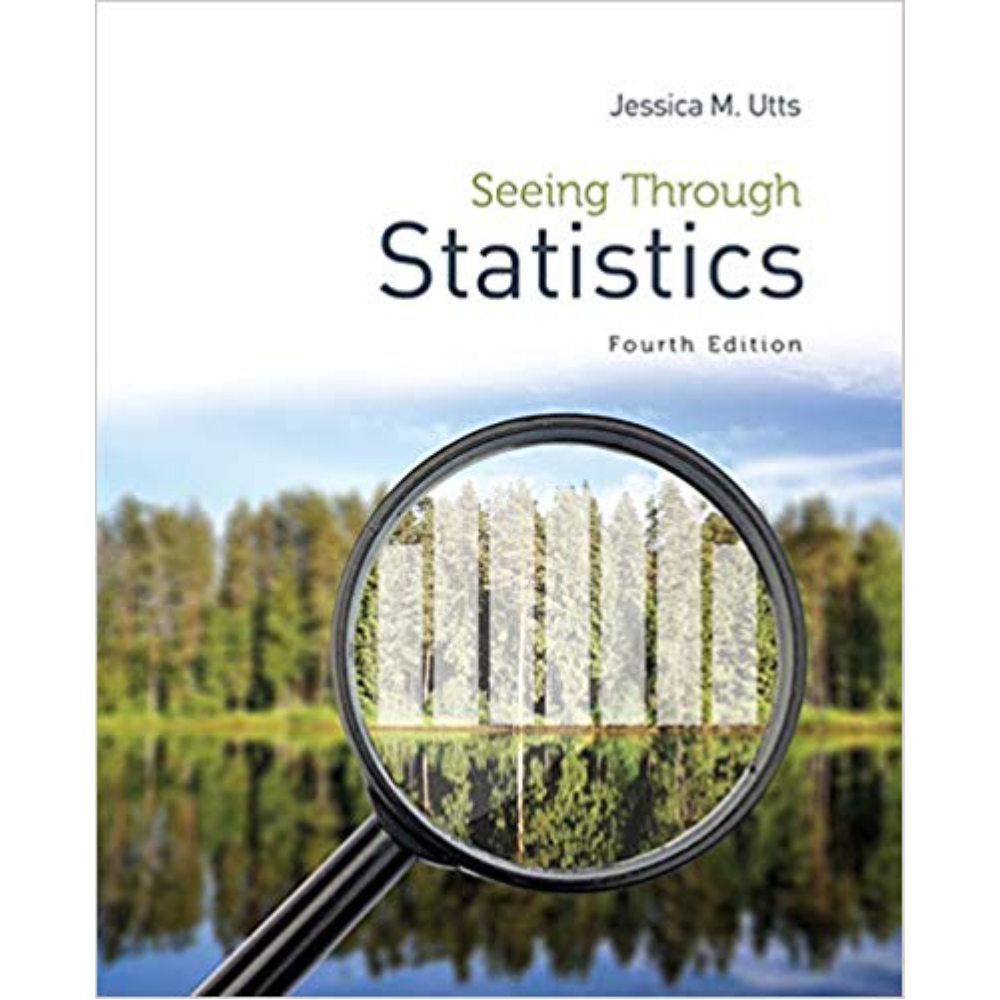
Seeing Through Statistics 4th Edition By Jessica M. Utts – Test Bank
MULTIPLE CHOICE QUESTIONS
5. What impact can an outlier have on a correlation?
a. An outlier that is consistent with the trend of the rest of the data will inflate the correlation.
b. An outlier that is not consistent with the rest of the data can deflate the correlation.
c. An outlier in a smaller sample has an especially large impact on a correlation, compared to an outlier in a larger sample.
d. All of the above.
ANSWER: D
6. Which of the following could describe an outlier in a scatterplot?
a. An error in the recording of the data.
b. A gap in the explanatory variable where no data is available, followed by a point where data is available.
c. A point in the data set whose removal changes the correlation a great deal.
d. All of the above
ANSWER: D
7. In which case(s) should you be suspicious of a correlation that is presented?
a. When the data is likely to contain outliers.
b. When the sample size is small.
c. When removing one point in the data set actually reverses the direction of the trend.
d. All of the above
ANSWER: D
8. Suppose a correlation is found to be very weak. What does this mean about the relationship between the two variables?
a. There is no linear relationship between the two variables being measured.
b. There may be separate linear relationships that are being masked by a third variable that was not accounted for.
c. There may be a different type of relationship between the variables; just not a linear one.
d. All of the above.
ANSWER: D
FILL-IN-THE-BLANK QUESTIONS
9. A third variable that was not accounted for can __________ the relationship between two measurement variables being studied.
ANSWER: MASK OR DEFLATE
10. A data point that is far removed from the rest of the data is called a(n)__________.
ANSWER: OUTLIER
MULTIPLE CHOICE QUESTIONS
14. Which of the following can get in the way of concluding a causal connection between two measurement variables?
a. A weak correlation.
b. An observational study.
c. Confounding variables.
d. All of the above.
ANSWER: D
15. When is it appropriate to draw a causal connection between two measurement variables?
a. When there is a strong correlation between them.
b. When the data were collected through an observational study.
c. When the observed association between the variables makes sense.
d. None of the above.
ANSWER: D
16. Which of the following statements is true?
a. Legitimate correlation never implies causation.
b. Legitimate correlation does not necessarily imply causation.
c. Legitimate correlation is equivalent to causation.
d. Legitimate correlation implies causation in the case of a single observational study, as long as the researchers tried to control for confounding variables.
ANSWER: B


Reviews
There are no reviews yet.